How to get Windows Container logs into Azure Monitor (AppServiceConsoleLogs)
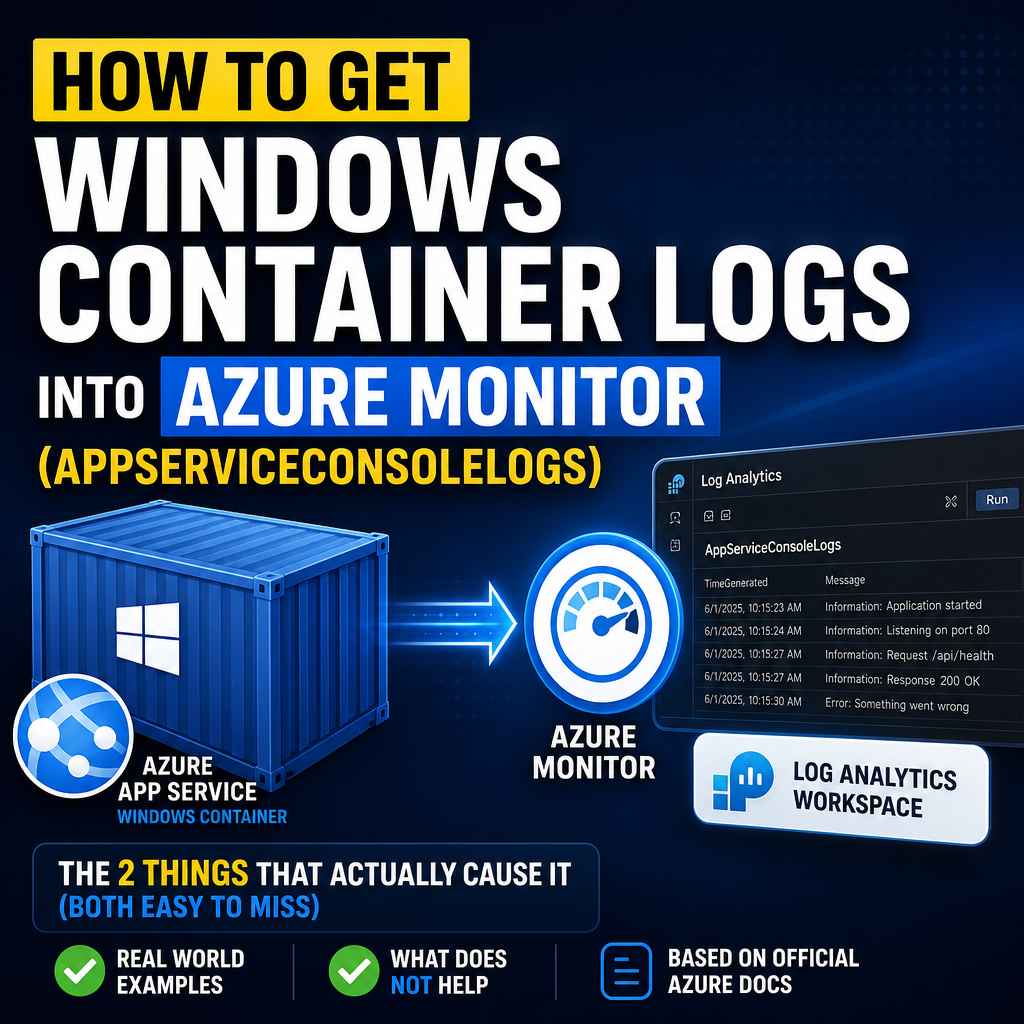
If you run a Windows container on Azure App Service and your application’s logs never show up in Log Analytics, this guide covers the two things that actually cause it. Both are easy to miss, and neither is in the documentation.
Everything below was tested against a real Windows container app. I’ve also listed what does not help, so you don’t waste time on it.
This is the Source documentation we will be following. If things change I would look to this for guidance. Azure App Service monitoring data reference
Prerequisites
- An Azure App Service running a Windows container (
kind = app,container,windows) - A Log Analytics workspace
- A container image you can rebuild (you may need to change one line in the Dockerfile)
- An app that writes to stdout. A normal ASP.NET Core
ILoggerapp is fine
Note: Windows containers require a Premium v3 plan (P1v3 or larger). That’s a hosting requirement, not a logging one.
The Short Version
- Your image must not have an
ENTRYPOINT. App Service has to start your process. - Query both
ResultDescriptionandMessage. A Windows container writes toMessage.
If logs are missing entirely, it’s almost always #1. If the app looks healthy but you can’t find your messages, it’s #2.
Setting Up the Image
This is the part that catches people out.
If your Dockerfile has an exec-form ENTRYPOINT, App Service’s startup command is passed as CMD, and Docker appends CMD as arguments to ENTRYPOINT instead of replacing it. Your ENTRYPOINT still wins, App Service never launches your process, and its log collector never attaches.
The result: AppServiceConsoleLogs stays completely empty. Not even container startup messages.
Change this:
FROM mcr.microsoft.com/dotnet/aspnet:9.0-windowsservercore-ltsc2019
WORKDIR C:\app
COPY publish/ .
ENV ASPNETCORE_URLS=http://+:80
EXPOSE 80
ENTRYPOINT ["dotnet", "myapp.dll"]
Just delete the ENTRYPOINT line:
FROM mcr.microsoft.com/dotnet/aspnet:9.0-windowsservercore-ltsc2019
WORKDIR C:\app
COPY publish/ .
ENV ASPNETCORE_URLS=http://+:80
EXPOSE 80
Rebuild and push. If you don’t have Docker locally, you can build in Azure:
az acr build --registry <your-acr> --platform windows --image myapp:v2 .Setting Up the App
Open the app in the portal > Configuration > General settings > Startup Command, and enter the command that runs your app:
dotnet C:\app\myapp.dllNote: the path is the one inside your image (the WORKDIR you used), not a path on the App Service file system.
Then restart the app.
Note: App Service splits the startup command on whitespace and does not honour quotes. If your command needs quotes or arguments containing spaces, it will break in confusing ways.
Setting Up the Diagnostic Setting
Open the app in the portal > Monitoring > Diagnostic settings > Add diagnostic setting.
Tick the categories you want and send them to your Log Analytics workspace:
- AppServiceConsoleLogs: stdout / stderr
- AppServiceAppLogs: application logs
- AppServiceHTTPLogs: web server logs
- AppServicePlatformLogs: container operation logs
That is genuinely all the configuration required. Save it, then browse your app a few times to generate some log lines.
Validating It worked
Give it 5–10 minutes for ingestion, then run this in the workspace. Use coalesce, this is the second thing that catches people out:
AppServiceAppLogs
| where TimeGenerated > ago(30m)
| extend Txt = coalesce(ResultDescription, Message)
| project TimeGenerated, Level, Txt
| order by TimeGenerated desc
A Windows container puts your message in the Message column and leaves ResultDescription empty. A Windows code app does the exact opposite. The portal’s default queries and nearly every KQL sample you’ll find online. Only read ResultDescription, so a container’s logs look missing even when they arrived.
Both columns are documented, so neither is wrong; nothing just tells you which one you’ll get.
And for console output:
AppServiceConsoleLogs
| where TimeGenerated > ago(30m)
| project TimeGenerated, Level, ResultDescription
| order by TimeGenerated desc
You should see your application’s log lines in both.
Things That Will Confuse You
Your log line appears twice. One ILogger.LogError() produces a row in AppServiceAppLogs and a row in AppServiceConsoleLogs. You’re paying ingestion on both.
The severity is wrong in one of them. Error is preserved in AppServiceAppLogs, but flattened to Informational in AppServiceConsoleLogs. Trust the AppLogs copy for severity.
AppServiceAppLogs looks like it’s working when it isn’t. A Windows container always emits platform reverse-proxy rows that look like real application logging:
Request starting HTTP/1.1 GET http://localhost/ - - -
Executing endpoint '/{**catch-all}'
Proxying to http://10.x.x.x:300NN
Those appear whether or not your app logs anything. Filter them out before concluding logging works:
AppServiceAppLogs
| where TimeGenerated > ago(30m)
| extend Txt = coalesce(ResultDescription, Message)
| where Txt !contains "Proxying to" and Txt !contains "Request starting"
| project TimeGenerated, Level, Txt
The console text has odd formatting. The AppServiceConsoleLogs copy is the raw console output, including the ASP.NET Core formatter’s leading spaces and a trailing \r\n. Exact-match filters will miss it.
What Does NOT Fix This
I tested each of these on a Windows container that wasn’t exporting logs. None of them made any difference, so don’t bother:
- App Service logs > Application logging (Filesystem): no effect on a container.
WEBSITES_ENABLE_APP_SERVICE_STORAGE=true: no effect on logging.- Generating more traffic. There is no volume threshold. I pushed roughly 8,000 log lines through a misconfigured app and got nothing.
- Checking for
console.logfiles in Kudu. This is the most misleading one. Those files are written by a completely separate pipeline from diagnostic settings. The file existing does not mean the export is working, and its absence doesn’t mean it’s broken. I confirmed this by making every log file appear in Kudu and watching Log Analytics stay empty.
How to Tell Which Problem You Have
Check whether AppServiceConsoleLogs has any rows at all for your app:
AppServiceConsoleLogs
| where TimeGenerated > ago(1h)
| summarize count() by _ResourceId- Zero rows, not even container startup messages: the collector never attached. That’s the
ENTRYPOINTproblem. Rebuild the image without it. - Rows exist but you can’t find your messages: the collector is fine. That’s the column problem. Use
coalesce(ResultDescription, Message).
About Author