How to Export Logs, Metrics, and Traces from Azure Container Apps with OpenTelemetry
Getting observability data out of Azure Container Apps can be frustrating. The documentation is scattered, and most examples only cover Application Insights. But what if you want to send telemetry to Datadog, Grafana, or your own collector?
Good news: Azure Container Apps has a managed OpenTelemetry agent that makes this surprisingly simple. Here’s a complete, working guide.
This is based on the following guide
Collect and read OpenTelemetry data in Azure Container Apps
What We’re Building
A minimal .NET 10 application that exports logs, metrics, and traces via OpenTelemetry. No complex configuration—Azure handles the heavy lifting.
Time required: About 15 minutes
Prerequisites
- Azure CLI installed and logged in
- Docker installed
- An Azure Container Apps environment (or we’ll create one)
- A Docker Hub account (or Azure Container Registry)
Step 1: Create the .NET Application (Skip to Step 4 to use the premade image)
Create a new empty web project:
dotnet new web -n OtelDemo
cd OtelDemo
Add the OpenTelemetry packages:
dotnet add package OpenTelemetry.Exporter.OpenTelemetryProtocol
dotnet add package OpenTelemetry.Extensions.Hosting
dotnet add package OpenTelemetry.Instrumentation.AspNetCore
Replace Program.cs with this:
using System.Diagnostics;
using System.Diagnostics.Metrics;
using OpenTelemetry.Logs;
using OpenTelemetry.Metrics;
using OpenTelemetry.Trace;

var builder = WebApplication.CreateBuilder(args);

// Custom telemetry sources
var meter = new Meter("MyApp", "1.0.0");
var requestCounter = meter.CreateCounter<int>("myapp.requests");
var activitySource = new ActivitySource("MyApp");

// Configure OpenTelemetry
builder.Services.AddOpenTelemetry()
    .WithMetrics(m => m
        .AddMeter("MyApp")
        .AddMeter("Microsoft.AspNetCore.Hosting")
        .AddMeter("Microsoft.AspNetCore.Server.Kestrel")
        .AddOtlpExporter())
    .WithTracing(t => t
        .AddSource("MyApp")
        .AddAspNetCoreInstrumentation()
        .AddOtlpExporter());

// Add logging with OTLP
builder.Logging.AddOpenTelemetry(o =>
{
    o.IncludeFormattedMessage = true;
    o.AddOtlpExporter();
});

var app = builder.Build();

app.MapGet("/", (ILogger<Program> logger) =>
{
    using var activity = activitySource.StartActivity("HandleRequest");
    requestCounter.Add(1);
    logger.LogInformation("Request processed at {Time}", DateTime.UtcNow);
    return "Hello OpenTelemetry!";
});

app.Run();
The magic is UseOtlpExporter()—it enables OTLP export for traces, metrics, and logs with one line.
Step 2: Create the Dockerfile
Create a file named Dockerfile in your project folder:
FROM mcr.microsoft.com/dotnet/sdk:10.0 AS build
WORKDIR /src
COPY *.csproj .
RUN dotnet restore
COPY . .
RUN dotnet publish -c Release -o /app

FROM mcr.microsoft.com/dotnet/aspnet:10.0
WORKDIR /app
COPY --from=build /app .
ENV ASPNETCORE_URLS=http://+:8080
EXPOSE 8080
ENTRYPOINT ["dotnet", "OtelDemo.dll"]
Step 3: Build and Push to Docker Hub
# Login to Docker Hub
docker login

# Build the image
docker build -t yourusername/otel-demo:v1 .

# Push to Docker Hub
docker push yourusername/otel-demo:v1
Step 4: Deploy to Azure Container Apps
Now the Azure side. First, set your variables (PowerShell):
$RESOURCE_GROUP="your-resource-group"
$ENVIRONMENT="your-environment-name"
Or Bash:
RESOURCE_GROUP="your-resource-group"
ENVIRONMENT="your-environment-name"
Option A: Send to Aspire Dashboard (Great for Testing)
The Aspire Dashboard is a free, easy way to visualize your telemetry.
Deploy the dashboard:
In the container app Environment you can just click the Create Dashboard button in the overview blade.Option B: Send to Datadog
Datadog has a dedicated configuration (not the generic OTLP command):
az containerapp env telemetry data-dog set \
  --name $ENVIRONMENT \
  --resource-group $RESOURCE_GROUP \
  --site "datadoghq.com" \
  --key "YOUR_DATADOG_API_KEY" \
  --enable-open-telemetry-traces true \
  --enable-open-telemetry-logs true \
  --enable-open-telemetry-metrics true
Datadog site values by region:
| Region | Site Value |
|---|---|
| US1 (default) | datadoghq.com |
| US3 (Azure) | us3.datadoghq.com |
| US5 | us5.datadoghq.com |
| EU | datadoghq.eu |
| AP1 | ap1.datadoghq.com |
Check your Datadog URL to find your region (e.g., app.us3.datadoghq.com → use us3.datadoghq.com).
Option C: Any OTLP Endpoint (Grafana, Honeycomb, etc.)
Use “http://aspire-dashboard:4317” for the default Aspire Endpoint.
az containerapp env telemetry otlp add \
  --name $ENVIRONMENT \
  --resource-group $RESOURCE_GROUP \
  --otlp-name "myCollector" \
  --endpoint "https://your-otlp-endpoint:4317" \
  --insecure false \
  --headers "Authorization=Bearer YOUR_TOKEN" \
  --enable-open-telemetry-traces true \
  --enable-open-telemetry-logs true \
  --enable-open-telemetry-metrics true
Step 5: Deploy Your Application
Use the image “icefire555/oteldemodotnet8:v1” if you want to use the one I’ve already built and published
az containerapp create \
  --name otel-demo \
  --resource-group $RESOURCE_GROUP \
  --environment $ENVIRONMENT \
  --image yourusername/otel-demo:v1 \
  --target-port 8080 \
  --ingress external
That’s it! No environment variables needed—Azure automatically injects OTEL_EXPORTER_OTLP_ENDPOINT into your container.
If you’re doing this from the portal and not CLI ensure you set the Target port in the container app under ‘ingress’ to 8080. And in the revision ensure that the health probes are set to port 8080.
Step 6: Test It
Get your app URL and hit it a few times:
# Get the URL
az containerapp show \
  --name otel-demo \
  --resource-group $RESOURCE_GROUP \
  --query "properties.configuration.ingress.fqdn" -o tsv

# Generate some traffic
curl https://your-app-url.azurecontainerapps.io
Request
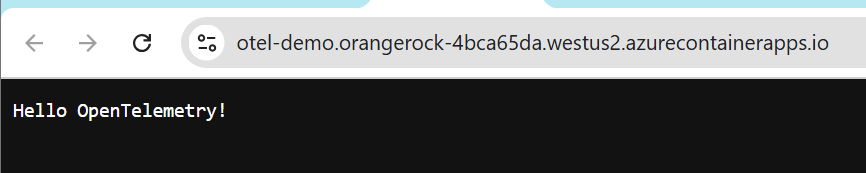
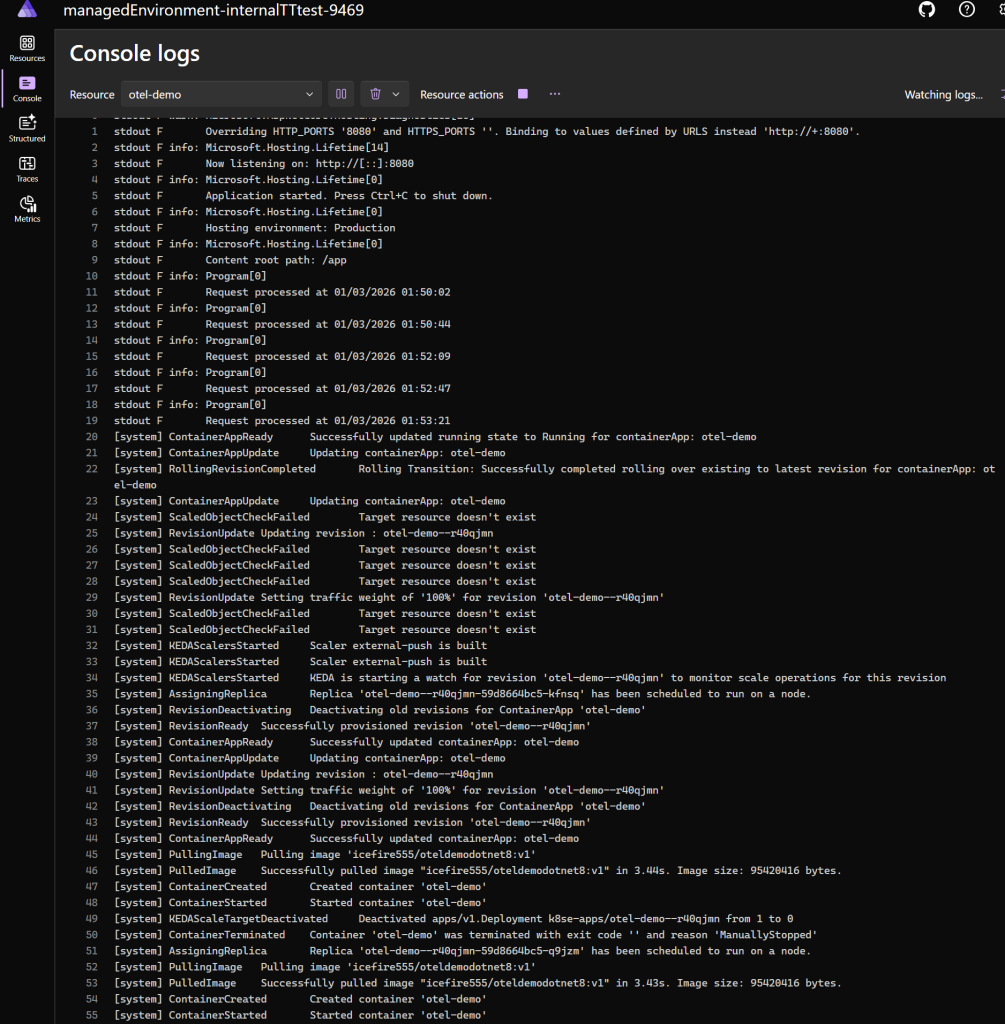
Check your dashboard (Aspire, Datadog, etc.)—you should see traces, logs, and metrics appearing within a minute or two.
Console Logs – Aspire
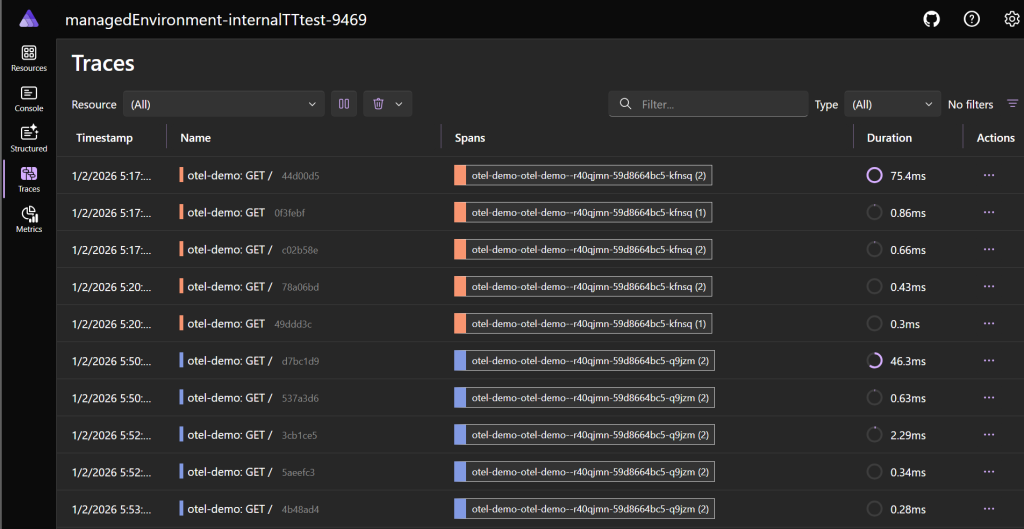
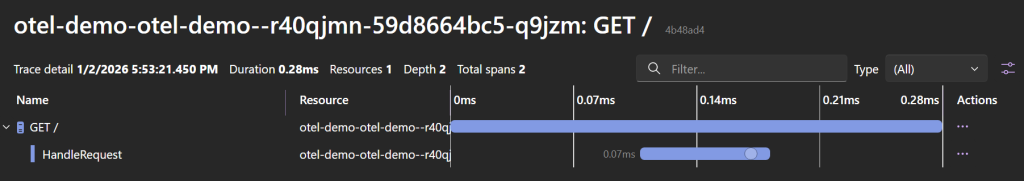
Traces
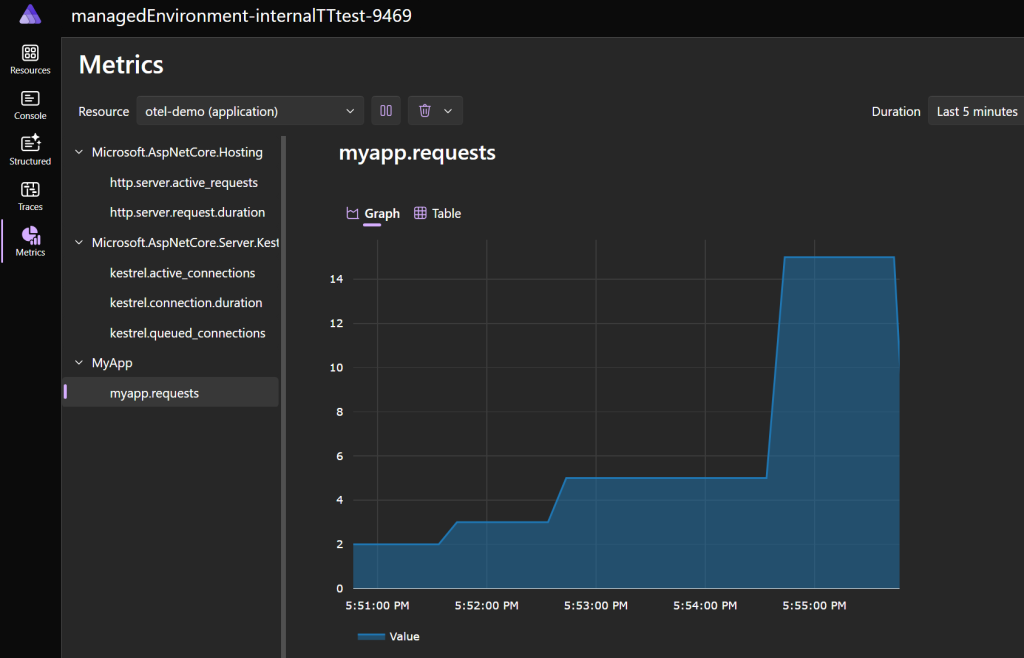
Metrics
How It Works
The managed OpenTelemetry agent runs at the environment level, not per-app. When you configure it:
- Azure deploys a managed collector in your environment
- It automatically injects
OTEL_EXPORTER_OTLP_ENDPOINTinto all your containers - Your app’s OpenTelemetry SDK picks up this endpoint and starts exporting
- The agent routes telemetry to your configured destinations
You can even send to multiple destinations simultaneously—for example, Datadog for production monitoring and Aspire Dashboard for local debugging.
Limitations to Know
- gRPC only: The managed agent only supports gRPC protocol (port 4317)
- Environment-level config: All apps in the environment share the same OTLP configuration
- Application Insights quirk: If using App Insights, it only accepts logs and traces—not metrics. Use Datadog or another OTLP endpoint for metrics.
Summary
The managed OpenTelemetry agent makes Azure Container Apps observability much simpler than it used to be. The key points:
- Add OpenTelemetry SDK to your .NET app with
UseOtlpExporter() - Deploy your app.
Happy monitoring!